Walk through any sourcing office in New York, Düsseldorf, or Dubai and you will hear the same phrase float across conference calls: “check what India can do.” That single line carries more weight than most people realise. Behind it sit cotton fields in Gujarat, knitting circles in Tirupur, embroidery clusters in Bareilly and a logistics network that moves billions of garments across oceans every year. The numbers are loud, the buyers are demanding, and the competition is fierce yet India keeps climbing the ranks of the world’s most watched Garment Export.
This piece breaks down where Indian-made clothing actually lands, who is writing the cheques, and how to read the trade signals using garment export data the right way.
1. India’s Standing Among the Top Garment Export Countries
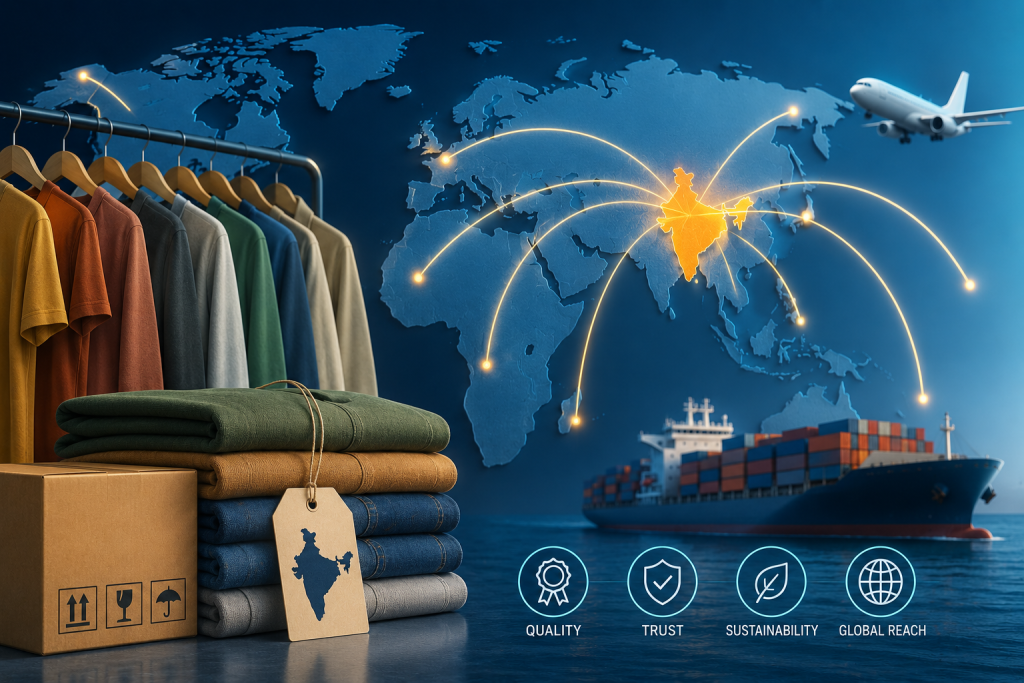
India is the world’s second-largest textiles and apparel exporter after China, contributing roughly 5% of global trade in the category. Apparel exports alone touched USD 15.99 billion in FY 2024–25, growing 10.03% year-on-year, while the wider textile and apparel basket crossed USD 36.6 billion. The Ministry of Textiles has set a vision target of USD 100 billion in textile exports by 2030, which means the next five years are going to look very different from the last five.
When global buyers shortlist the top Garment Export Countries, India consistently sits in the top three for cotton-based ready-made garments (RMG), home textiles and craft-led ethnic wear. The country’s edge comes from a fully integrated value chain fibre, yarn, fabric, dye, stitch and finish which most rival nations simply don’t have under one flag.
2. Top Destination Markets Buying Indian Garments
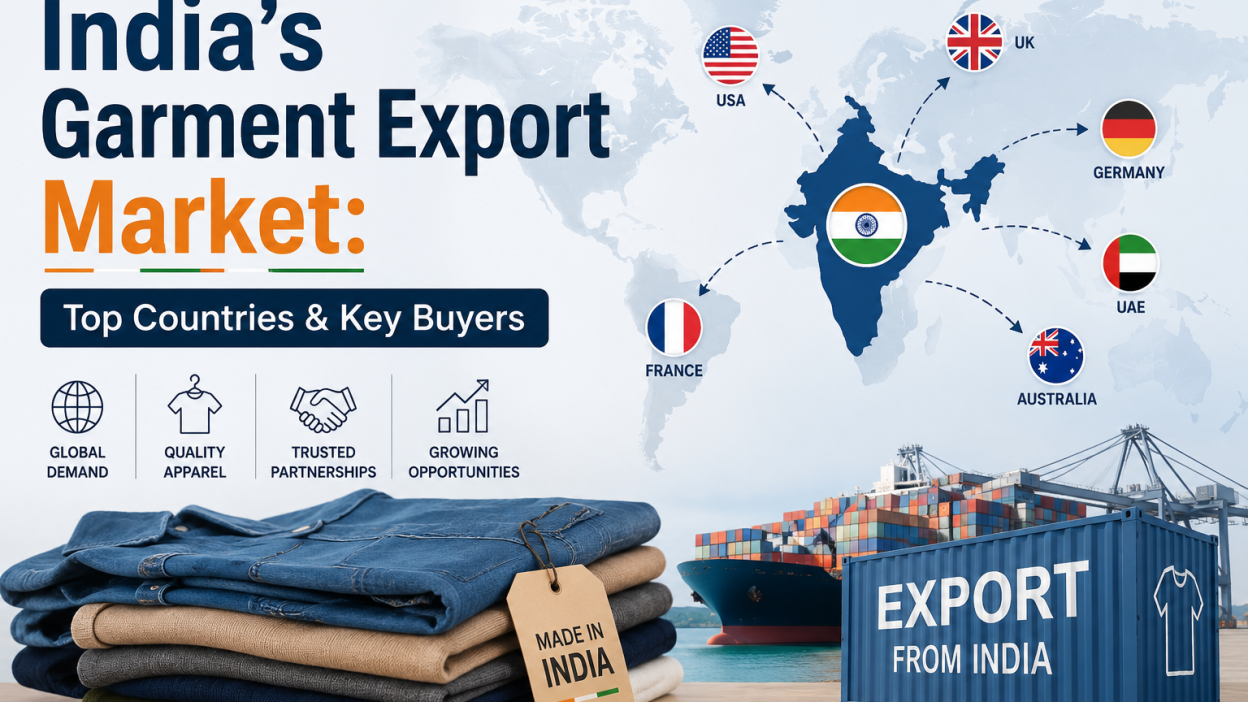
Indian garments are shipped to more than 100 countries, but a tight handful of markets account for the bulk of value. The table below shows the leading destinations based on H1 2025 garment export data, capturing how concentrated the demand really is.
| Rank | Destination | H1 2025 Value (USD) | Share of Indian Garment Exports |
| 1 | United States | 1.39 billion | ~34% |
| 2 | United Kingdom | 348.7 million | ~8.5% |
| 3 | United Arab Emirates | 342.7 million | ~8.4% |
| 4 | Germany | 268.9 million | ~6.6% |
| 5 | Netherlands | 221.8 million | ~5.4% |
| 6 | France | 158.2 million | ~3.9% |
| 7 | Poland | 152.3 million | ~3.7% |
The USA is the single biggest pull, importing close to one-fourth of India’s total apparel shipments. The UAE plays a dual role domestic retail demand plus a re-export hub serving Africa and the Levant. European buyers continue to favour Indian cotton knitwear, woven shirts and sustainable fibre garments, which is why Germany, the Netherlands and France remain non-negotiable on every exporter’s calendar.
Key strengths driving these flows include:
Cotton dominance– India is the world’s largest cotton producer, giving it a raw-material edge no other supplier can match.
Compliance maturity– top manufacturers in Tirupur, NOIDA and Bengaluru hold WRAP, GOTS, SA8000 and Sedex certifications that Western retailers insist on.
Mid-volume flexibility– Indian factories handle 5,000–50,000 piece orders profitably, a sweet spot Bangladesh and China often skip.
Design-led ethnic wear– embroidery, handwork and block-printing categories where India faces almost zero competition.
3. Decoding the Garments HS Code Structure
If you want to read Trade data correctly, you have to understand the Garments hs code system. The Harmonized System classifies all apparel under two principal chapters, and every export shipment, customs filing and tariff calculation hinges on this split.
| HS Chapter | Coverage | Example Sub-headings |
| Chapter 61 | Apparel & clothing accessories — knitted or crocheted | 6109 (T-shirts), 6110 (sweaters/jerseys), 6105/6106 (knit shirts/blouses) |
| Chapter 62 | Apparel & clothing accessories — not knitted or crocheted (woven) | 6203 (men’s suits & trousers), 6204 (women’s suits & dresses), 6205 (men’s shirts) |
India’s exports under Chapter 62 alone grew from ₹58,135 crore in FY 2018-19 to ₹70,396 crore in FY 2024-25, ranking 11th out of 97 HS chapters by export value and a remarkable 4th by trade surplus. Anyone pulling Garment Export Data from DGCI&S, ITC Trade Map or commercial platforms needs to query both chapters together — picking just one paints an incomplete picture.
4. Who Is Actually Buying — Key International Brands & Sourcing Houses
The buyer side is dominated by familiar retail names plus large sourcing intermediaries that consolidate orders for many smaller brands. Indian factories regularly produce for:
US majors: Walmart, Target, Macy’s, GAP, Kohl’s, PVH Corp (Tommy Hilfiger, Calvin Klein), Ralph Lauren and Carter’s.
UK & EU retailers: Marks & Spencer, Primark, Next, H&M, Zara (Inditex), C&A, Tesco F&F and Decathlon.
Middle East distributors: Landmark Group, Alshaya, Apparel Group — many of whom re-export onwards.
Sourcing agents: Li & Fung, MGF Sourcing and PDS Multinational handle multi-buyer consolidation out of Indian hubs.
5. Trends Reshaping India’s Garment Export Map in 2025–26
A few currents are quietly redrawing the order book. The 2025 US reciprocal-tariff revisions hit certain Indian apparel categories with duty stacks approaching 50%, which forced exporters into 15–20% price absorption to hold long-term clients — January 2026 saw a 3.8% dip in shipments to the US as a direct result. At the same time, the UK FTA (signed in 2025) is opening duty-free access on most apparel lines, and the long-pending EU FTA discussions are gathering pace. Sustainability documentation (BCI cotton, recycled polyester, traceability QR codes) has shifted from “nice to have” to a hard contract clause for European buyers.
Africa, Latin America and ASEAN are showing up more often in buyer enquiries, and digital sourcing platforms now generate a meaningful share of first-time orders for smaller Indian factories.
6. Where India Sits on the Global Leaderboard
To be clear eyed about it China is still the biggest exporter of garments in the world, clocking around USD 38.1 billion in H1 2025 alone, almost 40% of total global apparel trade. Vietnam follows at roughly USD 8.93 billion, with India in third place at USD 4.07 billion, ahead of Bangladesh, Indonesia, Pakistan and Turkey. The gap with China is wide, but India’s combination of cotton supply, design depth and the China-Plus-One sourcing shift gives it the strongest medium-term runway among the chasing pack.
Read This Blog Also- Sugar Export Data: World’s Largest Sugar Exporting Countries
Final Word
For exporters, importers and trade analysts who need granular shipment-level intelligence buyer names, HS-code-level volumes, port-wise movement and pricing benchmarks working with verified trade data sources changes the quality of every decision.
Platforms like Vyaapar One consolidate Indian customs data, buyer-supplier mapping and country-wise breakdowns into one workspace, making it easier to spot which destinations are heating up, which buyers are diversifying away from competitors, and where the next contract opportunity is hiding. In a market where the USA can swing a tariff overnight and the EU can rewrite a sustainability rule next quarter, that kind of visibility is no longer optional it is the cost of staying in the game.